

Advanced marketers today can measure the following based on a well-defined buyer persona.
- which blog post led to the most visits to your website
- what marketing tactics or format (video/images/infographic) worked best to engage your prospects
- if a visitor filled out a contact form after downloading a case study
- what type of content most engages our target market
Not many of us can tie each interaction and engagement directly to dollars and cents once a deal closes.
Enter: HubSpot's Multi-Touch Revenue Attribution Reporting
We are beyond stoked about this new feature rolled out in January 2020 to Marketing Hub Enterprise users.
Don't let the big words such as "revenue attribution" or "multi-touch" scare you. In this blog post, we will breakdown each of the components and walk you through the 4 critical aspects of this new reporting function.
1. Marketing Data
Customers are taking more actions online. Each of these interactions can be tracked. If you have multiple marketing teams that work across regions, product lines, sales channels, and departments, it is more critical than ever to have data analytics set up for the purpose of performance measurement.
2. Attribution
It is no secret that the customer journey has become more complex these days. As such, there are various attribution models that assess what is the actual value of each touchpoint that leads to a conversion. Multi-touch attribution is the act of determining the value of each customer touchpoint. Here's a demonstration of what it looks like.
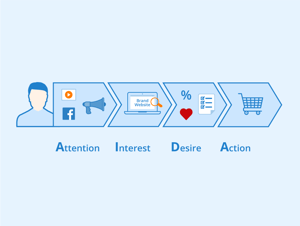 In this graphic, we are using a simplified illustration of the buyer's journey in 4 stages - from awareness (attention) to the ultimate buying activity (action). Let's assume, we first grab their attention via social media. They then visit our website to learn more about the product. We made it easy for them to engage with our content. As they approach the final decision, check out was seamless. Each of the activities that moved them to the next phase could be counted as 25% of the final revenue.
If they purchased a product for $1,000, each of the tactics that led to the sale would be worth $250 (approximately 1/4 of the revenue).
In real life, the buyer's journey looks a lot more like this: 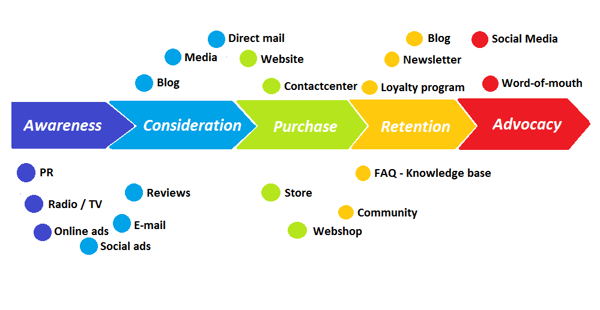
There are multiple steps to each stage. In a multi-touch attribution scenario, some touch points are weighted more than others based on the role it played in moving a customer through the buyer's journey.
3. Revenue
Multi-touch attribution only works if you have instances of how many deals are closed/won within your CRM along with the deal created and closed dates. From an operation stand point, not only do we want to have visibility into deals and revenue, but we also need to be able to track the various steps and interactions taken outside of marketing data to close a deal.
4. Measurement
This is the fun part!
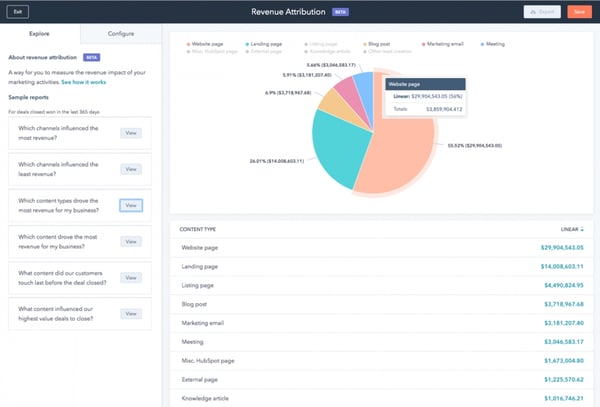
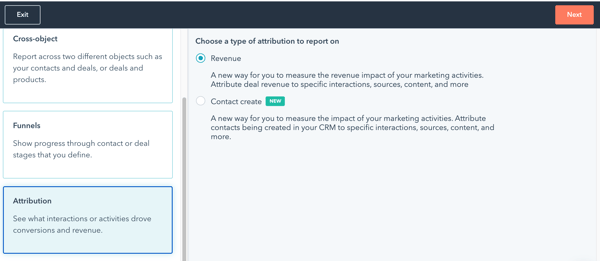
Once our data was loaded into HubSpot Marketing Enterprise, all it took was one click of a button. We navigated to the reports tab, clicked on create custom, and scrolled down on the list of report options on the right. And there it was! A Revenue Attribution Report that helps us measure what interactions or activities drove conversions and revenue.
In the past, we've had to help clients create custom integrations between multiple software platforms to achieve this (HubSpot, Salesforce, Bizible, etc... to name a few). With this new feature inside HubSpot, measuring if marketing is making your business money has never been easier.
Need help getting HubSpot Marketing Enterprise or setting it up and managing it? Reach out and let's talk about how adWhite can help you.